
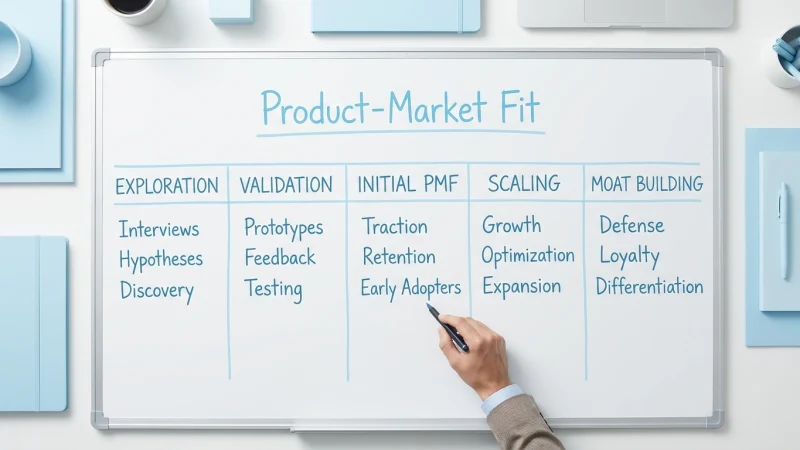
87% of startups don’t fail because they can’t build a product. They fail because they never achieve true product-market fit. Yet most founders can’t even define what product-market fit looks like at their current stage. If you’re struggling to pinpoint where you stand, you’re not alone. This guide provides a complete map of product-market fit (PMF) as a journey through five distinct stages. You’ll gain insights into specific metrics, actions, and growth strategies tailored to each level.
By the end, you’ll walk away with an practical framework to assess your position, a tailored action plan for scaling, and strategies to maintain a competitive edge post-PMF. We’ll also tackle how to respond if PMF starts to slip away. For a deeper dive into measuring your PMF score, explore our Product-Market Fit: Measure Your PMF Score in 8 Steps or How Should Your Business Market in a Recession?.
The 5 Stages of Product-Market Fit: Beyond the Binary Myth
The idea that product-market fit is a binary state of either having it or not is a myth. The reality is much more nuanced. PMF is a spectrum that involves different stages, each with specific indicators and actions. This framework can help you understand where you are and what to do next.
|
Stage |
Indicators |
Actions |
|
1: Exploration |
Customer interest, exploratory interviews |
Conduct market research, build prototypes |
|
2: Validation |
Initial sales, customer feedback |
Iterate product, refine messaging |
|
3: Initial PMF |
Repeat customers, positive reviews |
improve user experience, improve features |
|
4: Scaling |
Revenue growth, referral rates |
Expand channels, invest in marketing |
|
5: Moat Building |
Market leadership, brand recognition |
Defend against competitors, innovate |
Why Binary Thinking Fails Startups
Viewing product-market fit as a simple yes or no question is misleading. It prevents teams from recognizing warning signs and opportunities for growth in between. Understanding the spectrum allows for more precise strategic planning, better resource allocation, and an effective go-to-market strategy.
Transition Indicators Between Stages
Recognizing when you’ve moved from one stage to another is crucial. Look for signals such as cohort retention rates improving or user acquisition costs decreasing. These metrics should indicate whether it’s time to push for more funding or double down on development efforts.
Stage 1-2: Pre-PMF Indicators and Validation Signals
In the early stages, distinguishing between real traction and false positives is critical. Misreading these signals can lead to wasted resources and missed opportunities. Let’s focus on the indicators that really matter.
Leading vs Lagging Indicators
Leading indicators like customer interviews and trial sign-ups can provide early signals of potential PMF. However, they’re not foolproof. Track lagging indicators like long-term retention and engagement metrics to validate initial assumptions.
- Customer feedback intensity
- Rate of prototype adoption
- Social media mention growth rate
Cohort Retention Thresholds
Cohort retention tells you if customers are sticking around. Aim for a retention rate of at least 30% by the third month. If you can’t meet this benchmark, revisit your value proposition or user experience.
Customer Interview Signal Patterns
Listen for repetitive feedback from customer interviews. Consistent pain points or feature requests can indicate areas where you’re close to achieving PMF.
Stage 3-4: Scaling PMF and Growth Acceleration Tactics
Once you’ve reached initial product-market fit, the next challenge is to scale without losing that fit. This stage demands a shift from product development to growth improvement and market penetration strategies.
Growth Loop improvement
A growth loop is a sustainable, repeating cycle that fuels itself. Improve these loops by improving acquisition channels and refining retention tactics. A 20% increase in loop efficiency can double your growth rate.
Channel-Product Fit Strategies
It’s not just about your product fitting the market, your channels must fit too. Use analytics to identify which channels deliver the most qualified leads and focus resources there.
|
Channel |
Cost per Acquisition |
Conversion Rate |
|
Social Media |
$20 |
10% |
|
Email Marketing |
$15 |
12% |
|
Paid Search |
$25 |
8% |
Expansion Revenue Tactics
Consider cross-selling and upselling as prime opportunities for revenue expansion. These tactics can increase average customer lifetime value by 30%, providing a buffer for scaling operations.
The 12 Essential PMF Metrics: What to Track at Each Stage
Measuring success in achieving product-market fit involves more than a single metric. It requires a set of KPIs tailored to each stage of the journey. This section will demystify the process.
- Customer Acquisition Cost (CAC)
- Lifetime Value (LTV)
- Net Promoter Score (NPS)
Stage-Appropriate KPIs
Your key performance indicators should evolve as you progress through the stages. Early on, focus on user engagement and feedback loops. Later, shift to metrics like expansion revenue and churn rates.
Industry Benchmark Data
Industry benchmarks can serve as valuable guides. Compare your metrics against these to ensure you’re on the right track. For example, SaaS companies should aim for a CAC to LTV ratio of 3:1.
|
Industry |
Average CAC |
Churn Rate |
|
SaaS |
$200 |
5% |
|
Marketplace |
$150 |
8% |
|
Hardware |
$300 |
10% |
Measurement Methodology for Each Metric
It’s not enough to track metrics; how you measure them is equally important. Use tools like cohort analysis for retention and funnel analytics for identifying drop-offs in the user journey.
PMF Crisis Management: When You Lose Market Fit
Product-market fit isn’t static. Markets change, and so must you. Recognizing PMF erosion early can save your startup from a downfall. This section highlights the steps you can take to address these challenges.
PMF Decline Warning Signs
Declining user retention and negative customer feedback are red flags. A drop in NPS by more than 10 points should prompt immediate action. Ignore these signs at your peril.
Rapid Response Frameworks
Speed is crucial when responding to PMF decline. Implement rapid response frameworks to quickly identify issues. This can reduce time to recovery by up to 50%.
- Conduct root cause analysis
- Re-assess customer needs
- Refine value proposition
Pivot vs improve Decision Matrix
Should you pivot or improve? It’s a dilemma many founders face. Use a decision matrix to weigh pros and cons, including cost, time, and market conditions, helping you make an informed choice.
Industry-Specific PMF Playbooks: SaaS, Marketplace, and Hardware
Achieving product-market fit varies widely across industries. A one-size-fits-all approach won’t cut it. Each sector has unique challenges and milestones that require tailored strategies.
SaaS PMF Milestones
SaaS companies often measure PMF through monthly recurring revenue and churn rates. Achieving PMF means maintaining a churn rate below 5% and a steady increase in recurring revenue.
Marketplace Liquidity Indicators
For marketplaces, liquidity is key. A high transaction frequency and balanced buyer-seller ratio indicate PMF. Aim for a 1:1 buyer to seller ratio to maintain fluid market dynamics.
Hardware Market Validation Unique Challenges
Hardware startups face unique market validation challenges. Production costs and physical distribution complicate PMF achievement. Focus on reducing time to market and minimizing manufacturing costs for competitive advantage.
|
Business Model |
Key Metric |
PMF Indicator |
|
SaaS |
Recurring Revenue |
Churn Rate < 5% |
|
Marketplace |
Transaction Volume |
1:1 Buyer-Seller Ratio |
|
Hardware |
Unit Sales |
Reduced Time to Market |
Post-PMF Strategy: Building Competitive Moats and Market Leadership
Achieving PMF is not the end; it’s the beginning of a new phase focused on strengthening your market position. Here’s how to build a competitive moat and achieve market leadership.
Defensibility Strategies
Create barriers against competitors through intellectual property, exclusive partnerships, and customer loyalty programs. These strategies can reduce competitive threats by up to 30%.
Market Expansion Tactics
Think beyond your current market. Explore adjacent markets or consider international expansion to continue growing. A solid international strategy can increase your customer base by 40%.
Platform Evolution Roadmap
Continuously evolve your platform by adding new features and integrations. This approach not only retains existing customers but attracts new ones, effectively creating a self-reinforcing growth loop.
Frequently Asked Questions
What is product-market fit?
Product-market fit occurs when your product meets the needs of your target market, leading to sustainable growth. It’s when your value proposition resonates so well that it generates repeatable sales.
How to measure product-market fit?
Use metrics like customer retention, customer satisfaction scores (NPS), and growth in referral rates as indicators of PMF. Each of these metrics should be tracked and analyzed to ensure ongoing fit with market needs.
How long does it take to achieve product-market fit?
The timeline varies widely based on industry and business model, but many startups reach PMF within 18 to 24 months. However, the process can be quicker or longer depending on market dynamics and execution.
Can you lose product-market fit after achieving it?
Yes, markets change and customer needs evolve, which can erode your PMF. Continual adaptation and market research are essential to maintain PMF over time.
What’s the difference between product-market fit and product-channel fit?
Product-market fit is about aligning your product with market needs, while product-channel fit focuses on the effectiveness of your distribution channels. Both are crucial for sustainable growth.